Integrating
States
Change in mathematics is
often illustrated on paper by a sequence of two or more static diagrams reflecting
different states of the process or situation. To integrate these diagrams
conceptually into a coherent whole, the student must continually scan back
and forth among the diagrams to determine which of their features change
and which remain the same. This scanning is a drain on working memory (each
picture must be kept in mind while looking at the next), and can be eliminated
by using multi-state widgets.
a)
Rectangular coordinates in 3-space
Many students
entering a first linear algebra course have never seen a three-dimensional
coordinate system. This introduction was designed to explain how three-dimensional
systems are constructed, generalizing their understanding of two-dimensional
coordinate systems, and emphasizing the point that coordinate systems are chosen, not "decreed from above".
The original
version is essentially as presented in many texts, with the steps set out
sequentially in space (down the page, in this case). It's overly cumbersome,
requires scrolling (and scrolling back if the student wants to check an
earlier detail); more importantly, it requires extensive scanning to integrate.
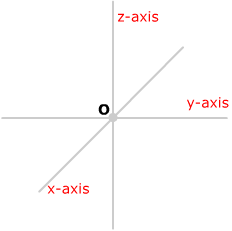
| To
define a rectangular coordinate system in 3-space |
| Choose
a point O (the
origin)
and three mutually perpendicular lines through O (the x-axis,
y-axis
and z-axis).
|
 |
|
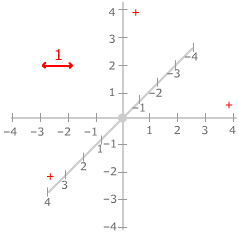
| Choose
a unit for measuring distances and a positive direction along
each axis. Assign each point on the axis its signed distance from
the origin as a coordinate. |
 |
|
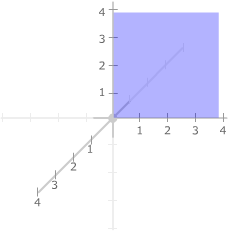
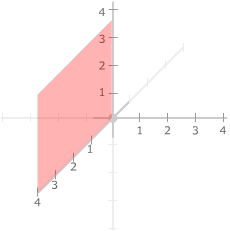
The
axes also define three coordinate planes: |
 |
 |
 |
the xy-plane
containing the x-axis and y axis
|
the yz-plane
containing y-axis and z-axis
|
the xz-plane
containing the x-axis and z-axis.
|
|
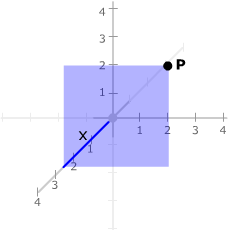
| The
x-coordinate
of a point P
is the coordinate x of the point on the x-axis where that axis
meets the plane through P parallel
the yz-plane. |
 |
|
| The
y-coordinate
of a point P
is the coordinate y of the point on the y-axis where that axis
meets the plane through P parallel
the xz-plane. |
 |
|
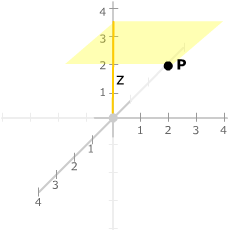
| The
z-coordinate
of a point P
is the coordinate z of the point on the z-axis where that axis
meets the plane through P parallel
the xy-plane. |
 |
|
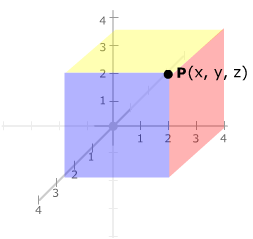
| The
point P is then
represented by the ordered triple (x, y, z).
We write the
point as P(x,
y, z). |
 |
|
The interactive version
presents a single changing image: successive parts of the definition are
layered on top of previous ones. No scrolling or visual scanning
is necessary, as there is no need to integrate successive slides. The parts
that remain unchanged are identically situated in space, and are thus perceived
as the unchanging objects. The parts that change are immediately visible
against the changed backdrop as "motion".
Note that some of the
text on one slide becomes grayed-out on the subsequent slide - still visible
to indicate its place in the process or for re-reading the previous step,
but not the main focus of the current slide.
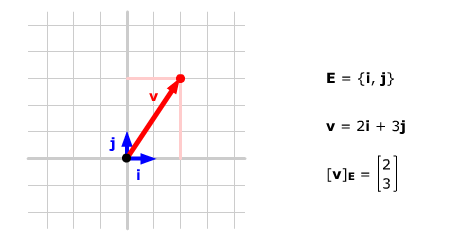
b) Coordinate Systems
This example is designed
to show how the same vector is represented differently in different coordinate
systems. (Both versions below still require additional verbal explanation.)
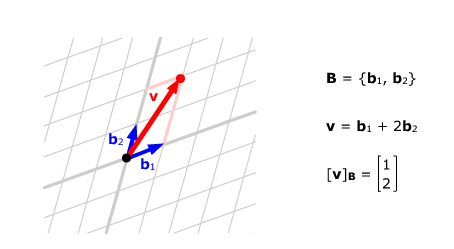
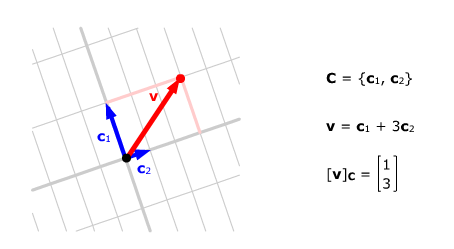
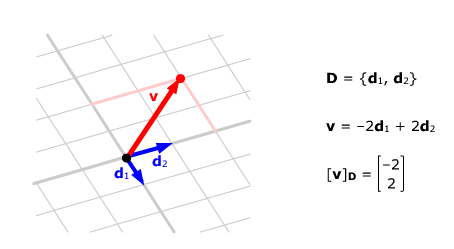
In the static 4-picture
version, students must scan back and forth to realize that the vector v is
the same in all cases; only the coordinate system changes.
In this dynamic version, it is immediately obvious perceptually that v remains
fixed ; the coordinate system merely changes "behind" it.